Welcome to MegunoLink.
MegunoLink is a Windows application for building user interfaces for your Arduino projects. Here we summarize all MegunoLink’s tools for your next Arduino project and provide links to detailed guides, examples and documentation. Our getting started guides provide a great place to begin if you are ready to dive in.
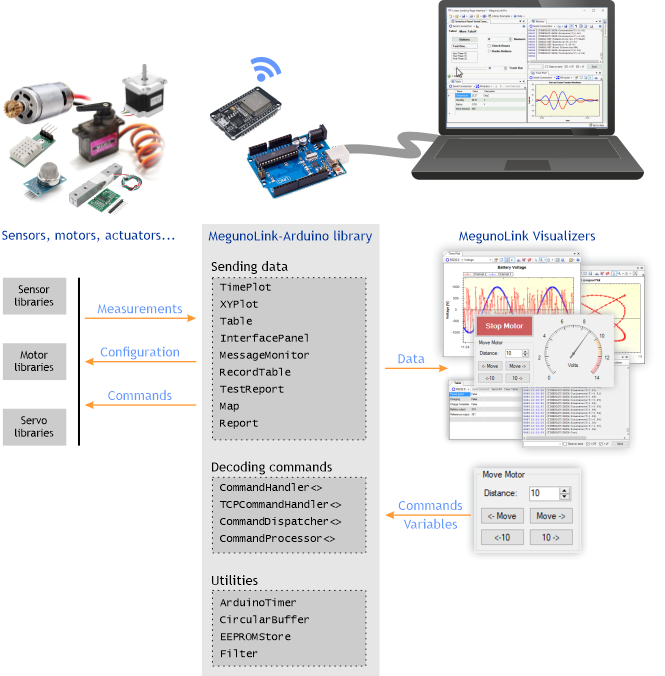
Your Arduino (or any other device) sends messages to MegunoLink to plot graphs, tabulate data and update the user interface. Use our Arduino library to create messages that send data, set axes titles or change control values using MegunoLink’s command protocol.
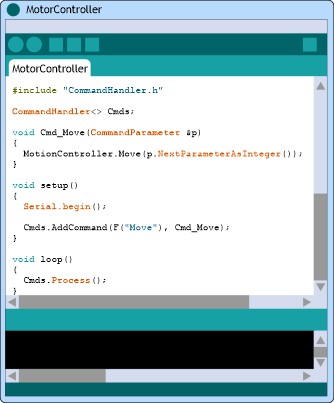
The Arduino library also includes a command handler for serial and TCP connections. Use the command handler in your Arduino sketch to have your program respond to messages sent from MegunoLink when a button is pressed or a variable changed.

Connections
Your Arduino (or any other device) can send data to MegunoLink over all sorts of connections, including:
- USB/RS232: the most common Arduino connection. This is the one that starts
Serial.begin(9600); - Ethernet: if your Arduino has an Ethernet connection, MegunoLink can talk to it via UDP or through a TCP client or TCP server connection.
- WiFi: MegunoLink can talk to ESP8266, ESP32 or any other devices with WiFi connections using UDP or through a TCP client or TCP server connection.
- XBee Series 2 Pro: using an XBee in API mode? We’ve got that covered.
- File: this one is really just for testing. MegunoLink can read serial data from a log file and replay it for you.
MegunoLink can talk to as many Arduino’s as you like. All at the same time. You can mix-and-match connection types or even connect to one Arduino using several methods (WiFi for data and Serial for debugging, for example). Set it all up with the Connection Manager.

Sending Data
Typical Arduino sketches use 3rd party libraries to read data from sensors and collect measurements. You might process the data in some way: filtering measurements, apply a calibration or convert to different units.
Then send the data to MegunoLink for plotting, storing in tables logging or controlling MegunoLink’s user interface. Our Arduino library creates messages to send data and commands to MegunoLink.
Check out the details below for more information on the visualizers available in MegunoLink.


Decoding Commands
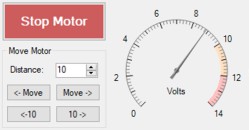
Several MegunoLink visualizers can send messages to your Arduino sketch. These commands could start a measurement, move a motor or change a configuration value, for example. Design a custom interface that sends commands when you press a button or change a control value using the Interface Panel visualizer.
Commands can be sent in any format.
Commands that start with a ! and end with a newline (\n) can be decoded by command handler classes in our Arduino library. The command handler calls a function in your Arduino sketch when it receives a matching command.
Check out our getting started articles to build your own custom interface panel:
- Build an Arduino interface, for an introduction to creating a custom interface panel in MegunoLink with buttons and other controls.
- Process serial commands with an Arduino, for an introduction to handling serial commands in your Arduino sketch.
Or dive into the reference documentation for more details on the:
- Serial and TCP command handlers,
- Interface panel visualizer
- Controls available for building custom interfaces,
- Creating serial commands,
- Updating the user interface from your Arduino sketch, and
- Updating Arduino variables from an interface panel.


Persistence, filtering and timing
Our Arduino library for MegunoLink includes several utilities to make Arduino programming easier including a:
- recursive filter to remove noise from your measurements,
- timer to simplify asynchronous coding,
- configuration wrapper to save settings in the device EEPROM so they aren’t lost when power is removed.
Check out MegunoLink’s Arduino library reference for more information.


Not using an Arduino?
MegunoLink visualizers decode special serial commands, which can be sent by any microcontroller. Check out the MegunoLink C library for MPLAB X and the message reference for each visualizer in the documentation.
Visualizers
MegunoLink projects are built from visualizers. Visualizers are windows that you dock in the in the MegunoLink application. They present data from your Arduino sketch or host a user interface for your project.
By default, data is received and displayed on all relevant visualizers. Most visualizers support Message Channels. Message Channels allow you to send data to specific visualizer windows.
This section provides an overview of the visualizers available in MegunoLink.
Graphs
The Time Plot and XY Plot visualizers show data received from your Arduino on a graph:
- Time plot: values are plotted against the time that they were received. Turn on run mode and the graph will scroll automatically to show the latest data as it is received.
- XY plot: your sketch sends both the x (horizontal) and y (vertical) values, which are plotted in pairs.
Both plots support multiple series, a left and right y-axis, automatic and manual scaling and extensive customization.


Interface Panel
Interface panels provide a blank design surface for you to drag-and-drop controls—such as buttons, text boxes and gauges—to create a completely custom user interface. Set up the commands and data that are sent to your Arduino sketch when a button is clicked or a control value is changed. Or bind names to variables in your Arduino sketch and update the the variables from an interface panel. Create a library of configurations that you can easily select and upload to your device.
Send commands from your Arduino sketch to manipulate interface panels by changing control values, appearance and visibility.


Tables
Table visualizers show data received from your Arduino sketch in a table. Two table visualizers are available:
- Property table, which is used for displaying a list of named properties. Use the property table to show configuration properties or the most recent sensor measurements.
- Record table: like a spreadsheet or database, the record table lists a row of data for each record received. Your Arduino sketch can send multiple columns of data for each record, or write to specific cells in the table.
Data in MegunoLink’s tables can be copied to your favorite spreadsheet program or saved to a file for more analysis.


Monitors
The monitor visualizer shows the unmodified serial stream MegunoLink is receiving from, and sending to, your device. Received text is shown in black while messages sent from MegunoLink are in orange. All lines of text are time-stamped and can be copied to the clipboard or saved in a text file for use in other programs.
MegunoLink’s message monitor visualizer separates out specially formatted text from the serial stream. It lets you create multiple text channels over the same connection to separate log, debug and formatted data.


Arduino Programming
The Arduino programmer is typically used for the production of new devices. It helps you upload programs, bootloaders, EEPROM configurations and program unique ids. Most common Arduino serial bootloaders are supported along with ISP programmers such as the AVR ISP Mk II. The Arduino programming visualizer will also download programs and EEPROM configuration from your Arduino, using an ISP programmer. The Arduino programmer can be used as part of self-test routines on your device, reporting test results and controlling progress through a programming sequence.


Reporting
The reporting tool writes the content of visualizers to files. Reports can be triggered manually, run periodically or triggered from your Arduino sketch by sending a command to MegunoLink. Reports provide a simple method to store data for analysis with other tools, such as Microsoft Excel, Scipy and Matlab.


Packaging and redistribution
Builder packages MegunoLink project files into a stand-alone installer that can be distributed to your end-users. Installers built with Builder do not require a separate installation or license for MegunoLink and are royalty free. Builder is sold separately.


