Overview
MegunoLink has two visualizers for plotting data:
- Time-Plot: each data point is a single value used for the vertical axis; time is plotted on the horizontal axis
- XY-Plot: each data point has two values: one for the horizontal (x) axis and one for the vertical (y) axis.
Send data and commands to these visualizers from your Arduino sketch using the TimePlot and XYPlot classes in our Arduino library.
Check out this video for an introduction to plotting with MegunoLink.
Sending Data from an Arduino Sketch for Plotting
In this example, we are plotting the value from a sensor attached to analogue port 0.
The Arduino sketch will read the sensor value and send it to MegunoLink. MegunoLink will plot the data in a time plot visualizer in a series named “My Sensor”.
|
1 2 3 4 5 6 7 8 9 10 11 12 13 14 15 |
#include "MegunoLink.h" TimePlot MyPlot; void setup() { Serial.begin(9600); } void loop() { int SensorValue = analogRead(0); MyPlot.SendData("My Sensor", SensorValue); delay(1); } |
The 3 lines required to send the data to MegunoLink are highlighted. The key steps are:
- Line 1:
#include "MegunoLink.h"— loads the MegunoLink library. - Line 3:
TimePlot MyPlot;— creates aTimePlotvariable namedMyPlot. This variable represents a plot in MegunoLink. Its methods take care of sending the right messages down the serial link to MegunoLink. - Line 13:
MyPlot.SendData("My Sensor", SensorValue);— theSendDatamethod value in theSensorValuevariable to MegunoLink. MegunoLink will plot the data in a series namedMy Sensor.SensorValueholds the last sensor measurement, which was made using theanalogReadfunction on the previous line. (SensorValue) to MegunoLink. It uses a series name of"My Sensor".
When you upload the analog plot sketch to your Arduino it will start sending serial messages like this:
|
1 2 3 4 |
{TIMEPLOT|DATA|My Sensor|123} {TIMEPLOT|DATA|My Sensor|127} : : |
The {TIMEPLOT|DATA|My Sensor|123} is is a special message that is recognized by MegunoLink. In this case, with data for plotting.
Plotting the data in MegunoLink
To plot the data being sent from your Arduino sketch in MegunoLink:
- Use the connection manager to configure a serial connection,
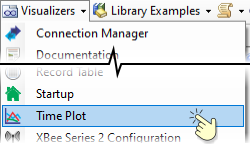
- Add a plot to your project by selecting Time Plot from the visualizers’ menu,
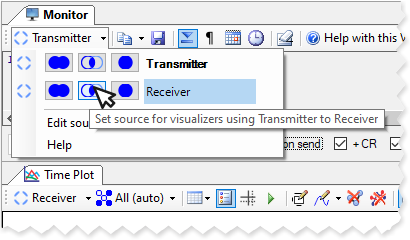
- Open the serial connection by clicking the source selector.
MegunoLink will decode the messages sent from the Arduino and plot data on the graph.
By default, the timescale will expand to show all data received. Turn on auto-scroll (![]() ) to keep the timescale fixed and have old data scroll off the left edge of the time plot.
) to keep the timescale fixed and have old data scroll off the left edge of the time plot.

Select Time Plot from the Visualizers menu to add a graph to your project.

Click the source selector to open the connection.

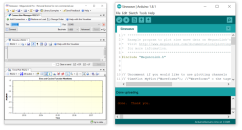
The MegunoLink Time Plot visualizer plotting data received from an Arduino

Make sure the correct connection is selected if nothing is plotted.
Plot Multiple Series on One Graph
MegunoLink can plot data from many different measurements on one graph. Each one will get drawn with a different color and name. These are called series. So you could plot battery voltage, temperature and humidity all on one graph using:
|
1 2 3 |
MyPlot.SendData("Battery", GetBatteryVoltage()); MyPlot.SendData("Temperature", GetTemperature()); MyPlot.SendData("Humidity", GetHumidity()); |
Sometimes it is better to send different measurements to different graphs, or use both the left and right y-axis. Sending data to multiple plots walks through the first case and using multiple axes describes the second.
Change Plot Appearance
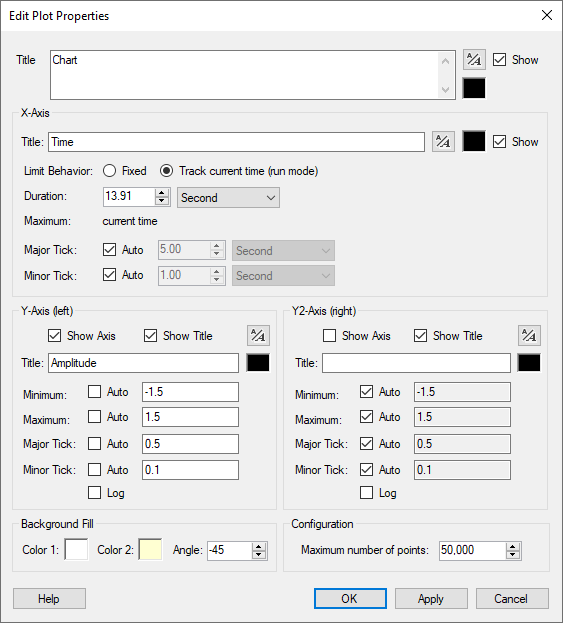
Many of the plot characteristics — including titles, colors and axis limits — can be changed. Changes can be made in MegunoLink or by sending commands to MegunoLink from your Arduino sketch.
Click the Properties button (![]() ) on the plot visualizer’s toolbar to open the Edit Plot Properties window.
) on the plot visualizer’s toolbar to open the Edit Plot Properties window.

Change titles, axis limits and background colors in the plot properties editor.
Use the TimePlot variable methods to set plot properties such as titles and axis limits. Refer to the Arduino library reference for a full list of methods.
|
1 2 |
MyPlot.SetYLabel("Voltage [V]"); MyPlot.SetYRange(0, 3.4); |
Change Series Appearance
A series’ marker, line color and style can be changed both from within MegunoLink and by sending serial commands to MegunoLink. Select the series then open the Edit Series Properties window using the button on the plot visualizer toolbar (![]() ).
).
Series properties can be sent from your Arduino sketch with each data point or as a separate command.

Change symbols and line styles using the edit series properties editor.
Any property you send from the Arduino sketch will override changes the user has made in MegunoLink. So it is often better to send series properties as a separate command unless you are determined to maintain the style.
|
1 2 3 4 5 6 |
TimePlot MyPlot; MyPlot.SendData("Battery", GetBatteryVoltage(), TimePlot::Blue, TimePlot::Solid, 2, TimePlot::Square); MyPlot.SendData("Battery", GetBatteryVoltage(), TimePlot::Blue); MyPlot.SetSeriesProperties("Battery", TimePlot::Blue, TimePlot::Solid, 2, TimePlot::Square); MyPlot.SetSeriesProperties("Battery", "b:s2"); |
Refer to the Arduino library reference, series styles page and the series string properties reference for a full list of methods and series styles available.


