Support forum for MegunoLink
-
cephid
- Posts: 8
- Joined: Wed Feb 10, 2021 12:01 pm
Wed Feb 10, 2021 12:12 pm
Hi,
I want to display duplicate runs of data on a single plot. Data plots with lines are ok until the ends, which want to join together. I tried saving a single set of data and loaded it twice onto a graph page and saw a same effect, so I guess it is not my code per se which is causing the problem.
Is there a way of avoiding this problem, preferably one which is automatic?
Thanks
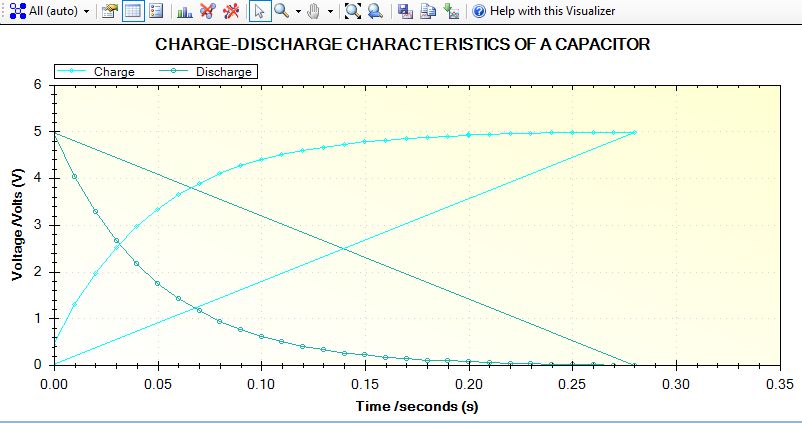
- hic1.jpg (50.18 KiB) Viewed 12092 times
-
philr
- Posts: 446
- Joined: Mon May 26, 2014 10:58 am
Fri Feb 12, 2021 10:53 pm
Hi, I think you would need to generate a new series name for each curve. i.e. "Discharge 1" "Discharge 2" "Discharge 3" etc
-
cephid
- Posts: 8
- Joined: Wed Feb 10, 2021 12:01 pm
Sun Feb 14, 2021 2:40 pm
Thanks Phil,
I finally understood how to solve the issue. I use a count in repeat loop so I could then set various parameters unique according to the count number for various channels

