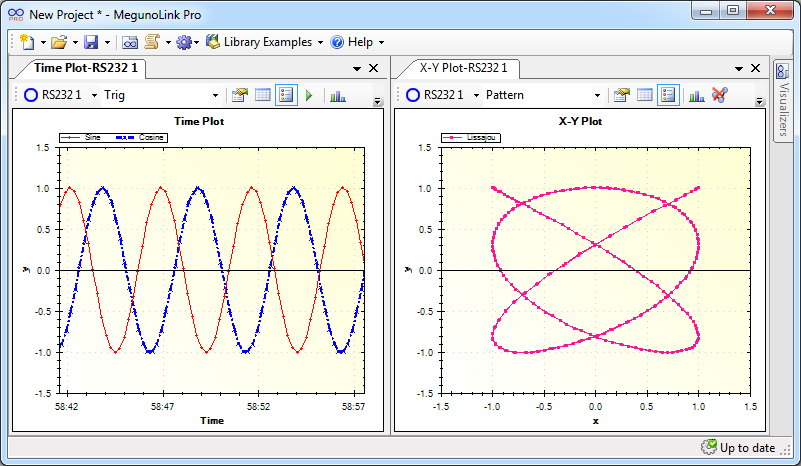
MegunoLink can plot data received from an Arduino, or any serial source, by parsing specially formatted messages. Currently two types of plots are supported:
- Time plots, which are similar to a chart recorder, showing a number plotted against time. Time plots support auto-scrolling, which keeps the edge of the time axis set to the current time so that old values scroll off the left of the plot. All the data is retained though. You can zoom out, or pause the plot, and see the earlier data.
- X-Y plots, which take two values from the microcontroller. One for the x (horizontal) axis and the other for the y (vertical) axis.

Both plots support:
- fine control of plot appearance and scales,
- multiple series, so you can show graphs of several different values at the same time,
- two y-axes, to plot values with different units on different scales,
- message channels, so you can include several different plot windows in the sample MegunoLink project,
- exporting the plot image to the clipboard or an image file, and
- exporting plotted data to the clipboard or a CSV file.
Use the TimePlot and XYPlot classes in our Arduino Library to send data to plots from your Arduino sketch. If you are not using an Arduino compatible device, or prefer to send raw messages, the plotting message reference describes the message format expected by the MegunoLink Pro plot visualizers.
A Video Example of Plotting
This video demonstrates our Sinewave example. This example can be found in our Arduino library. It includes a MegunoLink interface and an Arduino program which generates sine and cosine waveforms and plots them using MegunoLink’s Time Plot visualiser.
Reference
Common behaviors of plot visualizers are described below. For descriptions of individual visualizers refer to:
Point Limits
MegunoLink limits the maximum number of points in a series to prevent very large data-sets slowing your computer down.
By default, each series can contain up to 50,000 points. Old points are discarded to make way for new data when this limit is reached.
To change the maximum number of points in a series, click the Edit Properties button on the plot toolbar an enter a new value for the Maximum number of points.


