You can create multiple plots in your MegunoLink and send different data to each from your Arduino sketch using channels.
This is useful if, for example, you’d like to plot temperature on one graph and battery voltage on another. Both Time Plots and XY Plots support multiple plots. And you can have as many plots as you like.
To use multiple plots with our Arduino library, pass a channel name when you create a plot variable.
For example: TimePlot SinePlot("Sin"), CosinePlot("Cos"); will create two TimePlot variables. One named SinePlot and the other named CosinePlot. SinePlot will send data to a channel named “Sin” and CosinePlot will send data to a channel named “Cos”.
|
1 2 3 4 5 6 7 8 9 10 11 12 13 14 15 16 17 18 19 |
#include "MegunoLink.h" float x = 0; void setup() { Serial.begin(9600); } void loop() { TimePlot SinePlot("Sin"), CosinePlot("Cos"); SinePlot.SendData("Sine", sin(x)); CosinePlot.SendData("Cosine", cos(x)); x = x + 0.1; delay(100); } |
MegunoLink detects new channels automatically and includes them on the plot by default. So you’ll see both the sine and cosine curves on a single plot when running the Arduino sketch above:
The channels shown by a plot is controlled by the channel selector on the visualizer toolbar.
- When Select new automatically is selected, any newly discovered channels will be shown on the plot
- When Select default is selected, the default channel (the one you get with a
TimePlot Default;variable declaration) will be shown - When specific channels are selected, only those channels will appear on the plot

When Select new automatically is selected, any new channels will be included on the plot automatically.
To split the channels across multiple plots:
- Create a new time plot by selecting it from the visualizers menu.
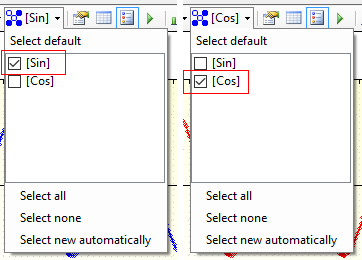
- Use the channel selector to choose which channels you want to see on each plot.
So by selecting specific channels for each visualizer you can show data on multiple plots:


